 illustration
1:1
illustration
1:1
Science/Math Theory Visualization
Subject
2x2 grid, do this for 4 famous PHD level science or math topics <instructions>
Input Variable: {argument name="theorem or formula" default="Theorem / Formula"}
Phase 1: Schematic Decomposition
Analyze the Notation: Identify the primary visual language of the scientist (Chalk on blackboard? Thermodynamics -> Engine Block.
Phase 2: The Dimensional Transition
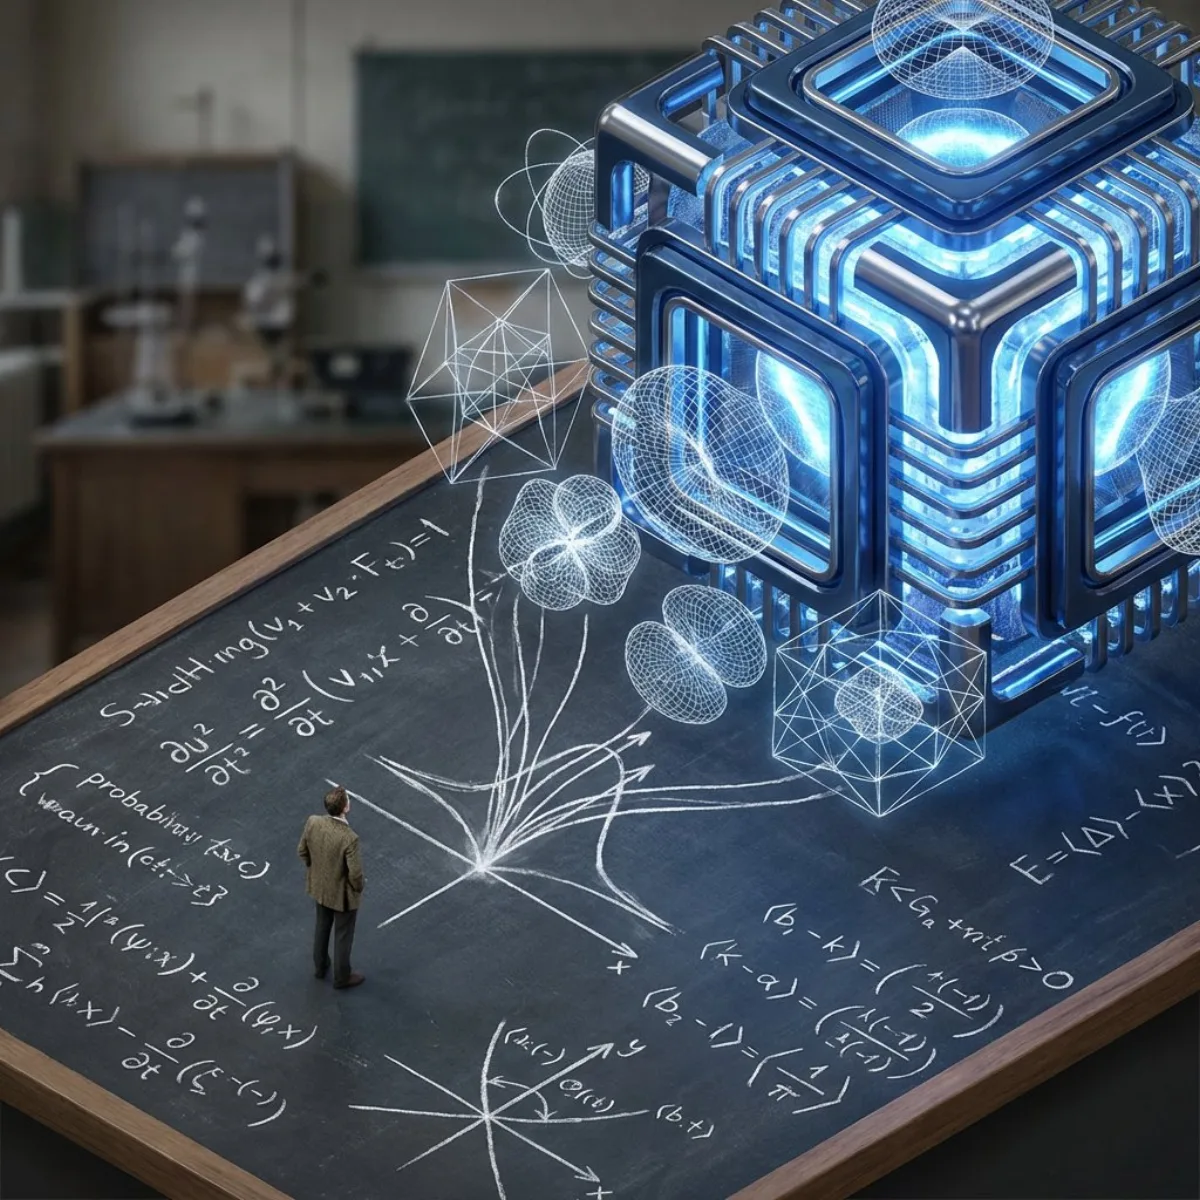
The Base: A flat surface covered in the [Notation Medium] (e.g., a slate blackboard covered in chalk equations). The Climax: At the top of the image, the wireframes have fully solidified into a photorealistic, impossible structure representing the theory. The Extrusion: The chalk lines physically lift off the surface. They begin as white
Composition
Output: High-Angle Isometric, "3D mod designer toy" style, stark contrast between sketchy lines and solid mass.
Lighting
Soft diffused key light with subtle rim separation, balanced shadow falloff.
Setting
Clean studio backdrop with subtle gradient transitioning to the floor.
Style
The Climax: At the top of the image, the wireframes have fully solidified into a photorealistic, impossible structure representing the theory.
Details
They begin as white wireframes, then gain opacity, then gain texture.